One post tagged with "Monitoring"
View All Tags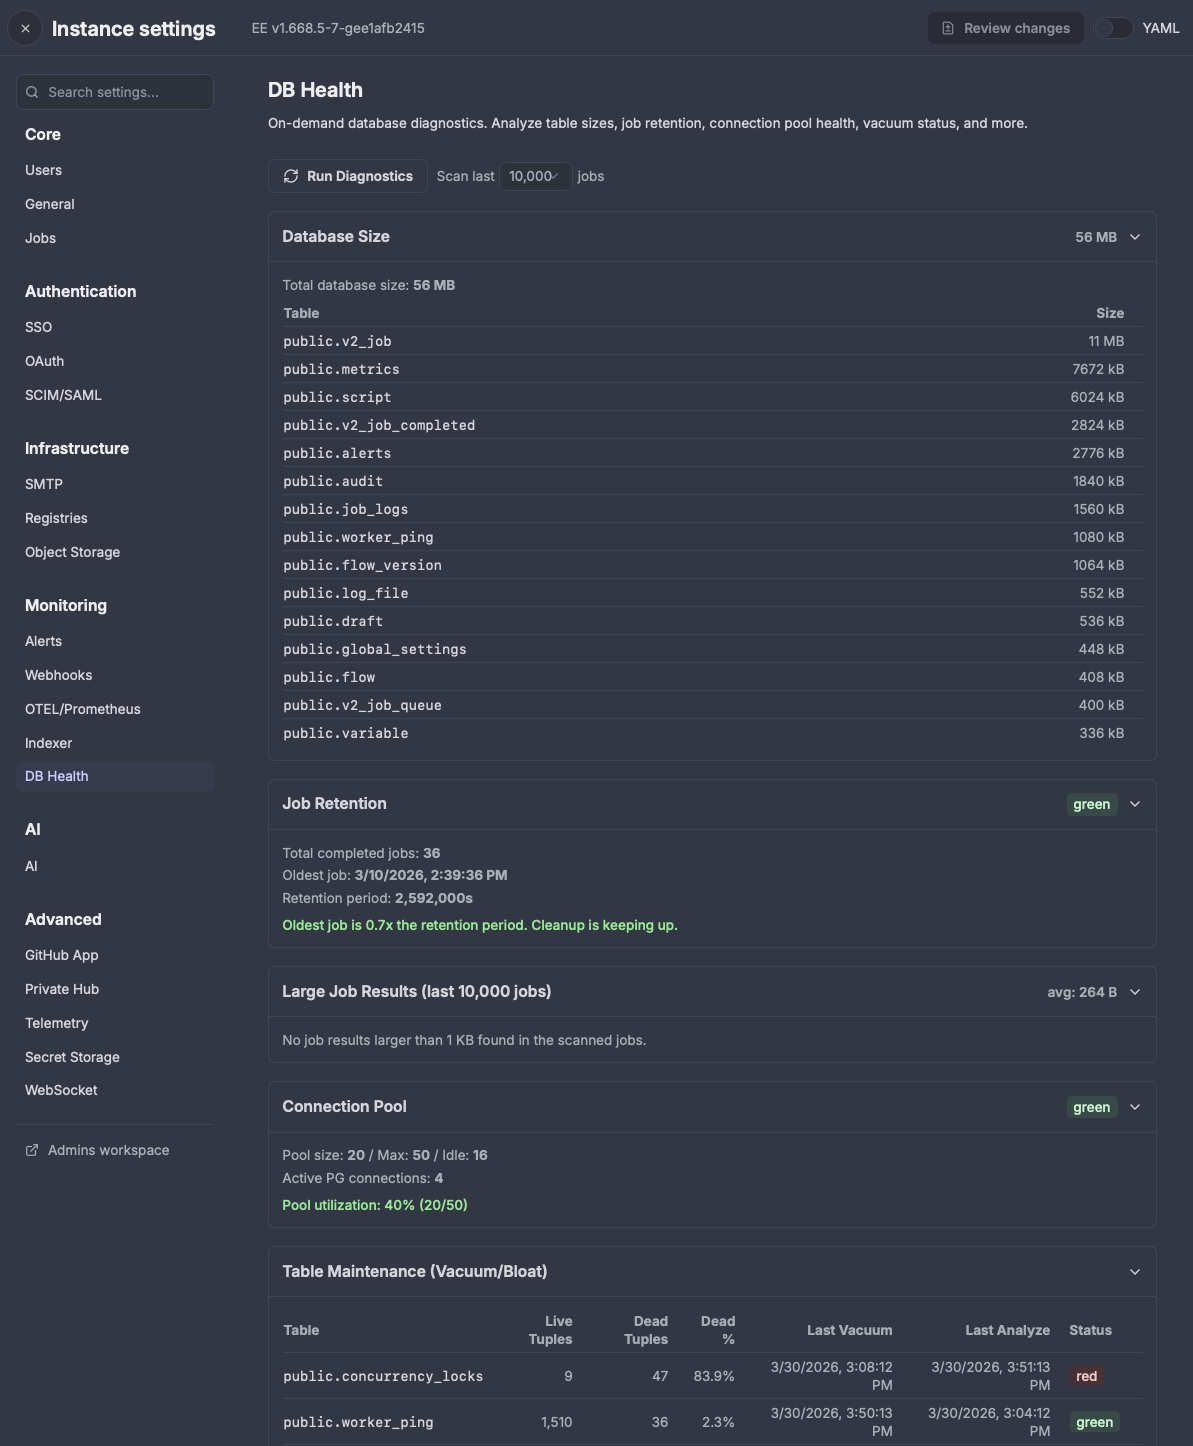
New on-demand database diagnostic dashboard for superadmins. Surfaces database size, job retention health, large job results, connection pool status, vacuum/bloat stats, slow queries, and datatable sizes — all from within Instance Settings.
New features
- On-demand DB health diagnostics accessible from Instance Settings > Monitoring > DB Health.
- Database size overview with top 15 tables by size.
- Job retention health: compares oldest completed job age to retention_period_secs with green/yellow/red status.
- Large job results: top 10 biggest result payloads (> 1 KB) with configurable scan depth (10k–500k jobs).
- Connection pool utilization with status indicators.
- Table maintenance: dead tuple ratios, last autovacuum/autoanalyze timestamps.
- Slow queries from pg_stat_statements (graceful degradation when extension not installed).
- Datatable breakdown: per-table size and estimated row count for instance-stored datatables.